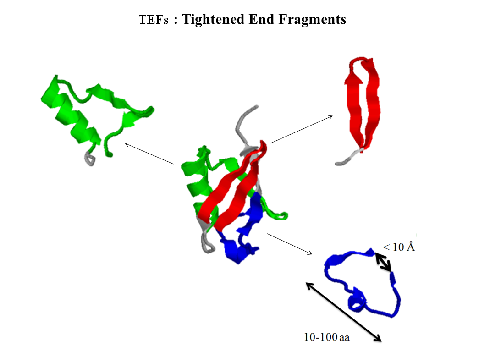
Figure 1: Decomposition of UB αβ roll into TEFs
contact: dirk.stratmann__at__upmc.fr
IMPMC, UPMC, UMR7590 CNRS, Campus Jussieu, 75005 Paris
RPBS, Bâtiment Lamarck, 15 rue Hélène Brion, 75013 Paris
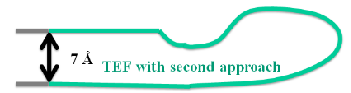
A globular protein is composed of long chains of amino acids folded occasionally on itself, forming loop like trajectories with typical Cα-Cα distances below 10 Å between the ends (fig.1). These fragments were initially called closed loops [1]. The histogram of the sequence separation between these contact residues presents a maximum at around 20 - 30 amino acids [2]. Later on, it was shown that the ends of these closed loops include mainly hydrophobic residues [3], and a thorough analysis demonstrated that these hydrophobic amino acids were highly conserved among structures of the same family even among distantly related members, and they were called topohydrophobic positions [4]. The concept of TEFs (Tightened End Fragments) emerged from the joint concepts of closed loops and topohydrophobic positions [5].
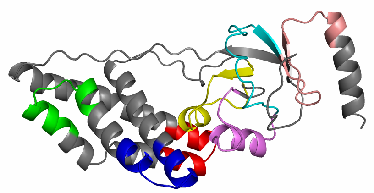
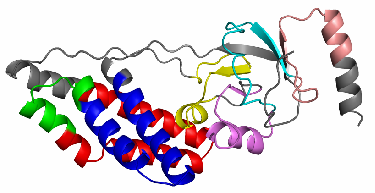
The decomposition of a protein structure into TEFs can be done in different ways because of redundancy due to overlapping TEF. This redundancy is quite huge, as the length of all possible TEF exceeds about 50 times the sequence length. The first approach (distance approach, TEF 1.0 program) selects the TEFs with the tightest ends in terms of distance between Cα-atoms (fig.2a).This approach is also used by the DHcL server from Berezovsky et al. [6]. The disadvantage of this approach is that the poor coverage of the protein by TEFs. In order to improve the splitting of a domain into its constituting TEFs, the second approach (score approach, TEF 2.0 program) selects a sequence decomposition by TEFs that minimizes the number of residues unassigned to any TEF and choose TEFs with the tightest ends in terms of distance between Cα-atoms (fig.2b).
For this task a graph-algorithm tests all combinations of TEFs yielding the optimal decomposition
according to a score. The best solution is the solution with the lowest score. The score is composed of three
individual scores, Scoregap which measure the percentage of residues unassigned to any TEF (gap),
Scorecα-cα which measure the mean of the distances between Cα-atoms and a third optional Scorefrag
which measure the number of TEFs (fragmentation) in the solution.
- The gap score Scoregap is simply the sum of gaps, i.e. the number of residues unassigned to any TEF
:
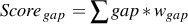 | (1) |
where wgap is the weight (default : 1.0) for this score.
- The distance cα-cα score Scorecα-cα is the sum of differences to an average distance davg
:
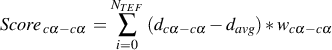 | (2) |
where dcα-cαis the distance between Cα-atoms of a TEF i, NT EF is the total number of TEFs in the solution
and wcα-cαis the weight (default : 1.0) for this score. davg is simply the middle of the interval of distances
![[dmax ]
-2-, dmax](TEFdoc5x.png) , with dmax being the maximum allowed distance.
, with dmax being the maximum allowed distance.
- The optional fragmentation score Scorefrag can be included to obtain a higher or lower fragmentation, i.e.
smaller or longer TEFs on average. Its formula is :
 | (3) |
where wfrag is the weight (default : 0.0) for this score. For wfrag > 0 a higher fragmentation will be obtained
and for wfrag < 0 a lower fragmentation will be obtained
The final score for a solution is the sum of the three scores :
 | (4) |
We have tested the two approaches - TEF 1.0 and TEF 2.0 - on a data base composed of 278 proteins with less than 25 % sequence identity in order to compare their coverage rate by TEFs on proteins. The distance approach (TEF 1.0) gives an average coverage rate of only (67±8)% while the score approach (TEF 2.0) attains (95±3)% (fig.3). At the same time the average distance between the TEF ends increased only from (5.1±0.3)Å (TEF 1.0) to (6.4±0.6)Å (TEF 2.0). If required, the TEF ends distance based optimization done by of TEF 1.0 can be done also by TEF 2.0 by setting the weight wgap for the gap score equal to zero (command line: -gw 0).
Step 1 : Give PDB file or enter the PDB code of the protein.
Step 2 : Choose an approach (TEF 1.0 or TEF 2.0) of the decomposition of protein into TEFs (see section
OPTIONS).
Step 3 : Depending on your needs you can change the default values of options for the selected approach (see
section OPTIONS) or keep them.
Step 4 : click on run and you will obtain the results.
Without any option, all PDB files in the current directory will be treated by the TEF program.
If only a specific PDB file should be treated by the TEF program, use the -pdbFile option to specify the path and filename of the PDB file. This PDB file can also be an assembly of several PDB files put into one single “multi-PDB” file.
If the PDB files are not in the current directory, specify with the -pdb option the path to the directory containing the PDB files to be treated by the TEF program.
The output files are stored by default in the current directory. This can be changed by specifying the output directory with the -out option.
The output files can be stored automatically in different sub-directories, one per PDB file (default: no sub-directories).
With this option TEF 2.0 will call pymol to generate a PNG file for each PDB. The TEFs are indicated by colors (see section 5.3). As the ray-tracing step can take a bit of time, the generation of the PNG file is deactivated by default.
Additional files for debugging purposes will be written.
The distance approach (-version 1) selects the TEFs with the tightest ends in terms of distance between
Cα-atoms (fig.2a).
The score approach (-version 2, default) selects a sequence decomposition by TEFs that minimizes the
number of residues unassigned to any TEF and choose TEFs with the tightest ends in terms of distance
between Cα-atoms (fig.2b).
Maximum distance between the Cα-atoms of the the TEF ends.
Default : 10.0 Å
Allowed : 4.0 - 15.0 Å
The minimum length of a TEF can be specified to avoid too short fragments.
Default : 10 AA
Allowed : 10 - 100 AA
The maximum length of a TEF can be specified to avoid too long fragments.
Default : 100 AA
Allowed : 10 - 100 AA
It’s possible to change the weight of each scores (formulas 1, 2 and 3) and modify the decomposition of the
protein structure into TEFs.
The solution will favor a higher coverage by TEFs for higher values.
Default: 1.0
Allowed : 0.0 – 100.0
The solution will favor TEFs with shorter distances at their end for higher values.
Default: 1.0
Allowed : 0.0 – 100.0
The solution will favor a higher/lower number of short TEFs for positive/negative values.
Default : 0.0
Allowed : -100.0 – 100.0
By default the maximum allowed overlap between two TEFs is 2 residues, which can be changed by this option.
The MAX_GAP value controls the search depth for the optimal selection of TEFs. MAX_GAP corresponds to the maximal length between two TEFs. The gaps are counted from the first possible TEF after the last residue of the current TEF, in order to jump over large part of the sequence without any TEF. A minimum value of 10 is recommended for MAX_GAP, a too small value may result in an incomplete search. Higher values will result in a longer search time, but not necessarily change the final result.
Default : 100 AA
Allowed : 0 - 300 AA
With this option the NACCESS [7] program can be used to restrict the TEF-ends to the protein core.
By default this filter for possible TEFs is deactivated.
The relative maximum Accessible Surface Area (ASA) of the TEF-ends is calculated by NACCESS [7]. A small value (< 50%) will constrain the TEF-ends to the protein core, if the option -naccess is also used.
Default : 25 %
Allowed : 1 - 200 % (for some cases NACCESS gives values > 100%)
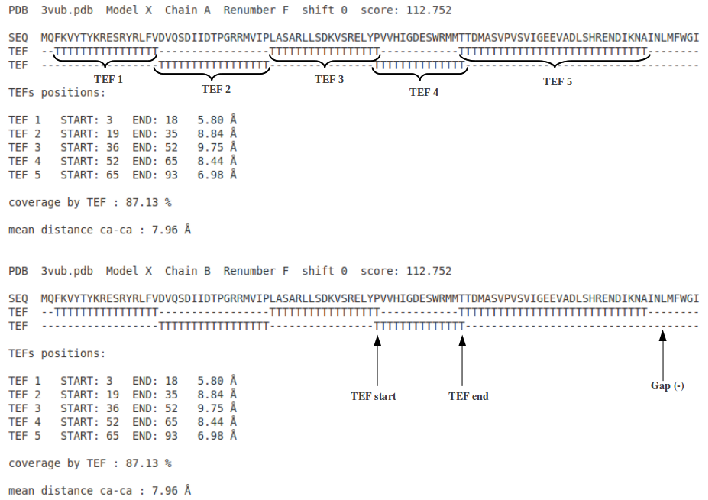
In the figure 4 is represented the sequence of the submitted structure and just below the corresponding TEFs. There are two lines of TEFs to better visualize when two TEFs overlap (maximum overlap 2 residues). Below are listed the TEFs (first residue, last residue and distance in Å).
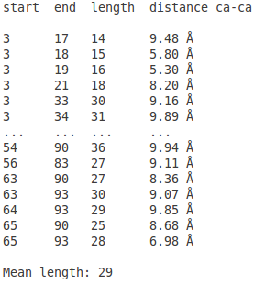
The list of all possible TEFs is represented (fig.5) like this :
- column 1 : first residue of the TEF
- column 2 : last residue of the TEF
- column 3 : size (in residues) of the TEF
- column 4 : distance in Å between the first and last residues of the TEF
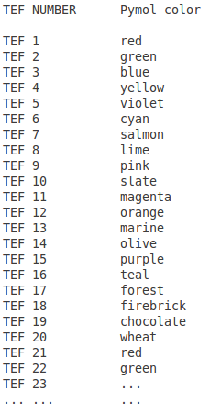
A pymol [8] script is generated which allowed to visualize in 3D the decomposition of the protein into TEFs. For that you have to download the cleaned PDB and the script then execute the pymol script. This script will write at the end a PNG image file (XXXX.png, XXXX = PDB id). With the -pymol option the TEF program will generate automatically this PNG image file along with the pymol script. The Figure 6 shows the color code corresponding to the TEF ids.
The parameters.tef file contains the command line as well as a list of all parameters used in the run.
The files beginning with “all_” summarize the results for all PDB files/chains that has been treated by the TEF program in the current run.
Gives the TEF decomposition solutions of all PDB files/chains in a compact form.
The list of sequence coverage values (in %) for all PDB files.
The list of average TEF ends distance values (in Å) for all PDB files.
A list of TEF lengths (in number of residues) of all selected TEFs for all PDB files.
Gives a list for all PDB files of the number of selected TEFs.
[1] Varda Ittah and Elisha Haas. Nonlocal interactions stabilize long range loops in the initial folding intermediates of reduced bovine pancreatic trypsin inhibitor. Biochemistry, 34(13):4493–4506, April 1995.
[2] I N Berezovsky, A Y Grosberg, and E N Trifonov. Closed loops of nearly standard size: common basic element of protein structure. FEBS Letters, 466(2-3):283–286, January 2000.
[3] I N Berezovsky, V M Kirzhner, A Kirzhner, and E N Trifonov. Protein folding: looping from hydrophobic nuclei. Proteins, 45(4):346–350, December 2001.
[4] Anne Poupon and Jean–Paul Mornon. Populations of hydrophobic amino acids within protein globular domains: Identification of conserved ’topohydrophobic’ positions. Proteins: Structure, Function, and Bioinformatics, 33(3):329–342, November 1998.
[5] M Lamarine, J P Mornon, N Berezovsky, and J Chomilier. Distribution of tightened end fragments of globular proteins statistically matches that of topohydrophobic positions: towards an efficient punctuation of protein folding? Cellular and Molecular Life Sciences: CMLS, 58(3):492–498, March 2001.
[6] Grzegorz Koczyk and Igor N Berezovsky. Domain hierarchy and closed loops (DHcL): a server for exploring hierarchy of protein domain structure. Nucleic Acids Research, 36(Web Server issue):W239–245, July 2008.
[7] Hubbard, S.J. and thornton, J.M. (1993), "NACCESS", computer program, department of biochemistry and molecular biology, university college london.
[8] Delano, W.L. The PyMOL Molecular Graphics System (2002) DeLano Scientific, san carlos, CA, USA. http://www.pymol.org.